Editorial
How to Get AI Trade Ideas from Your Charts in 15 Seconds
Staring at a chart for an hour trying to "see" the pattern? Those days are over. With our new AI Chart Analysis tool, you can go from a raw screenshot to a professional-grade trade strategy in seconds.
How to Get AI Trade Ideas from Your Charts in 15 Seconds
Staring at a chart for an hour trying to "see" the pattern? Those days are over. With our new AI Chart Analysis tool, you can go from a raw screenshot to a professional-grade trade strategy in seconds.
Whether you're a day trader hunting for breakouts or a long-term investor looking for the perfect entry, here is your step-by-step guide to using our "Analyze Chart" feature.
Step 1: Capture Your Setup
First, pull up your favorite asset on TradingView. Make sure the price action is clear.
Pro Tip: Keep your chart relatively clean. While the AI can read indicators like Volume, RSI, or Moving Averages, removing unnecessary "noise" helps it focus on the core market structure.
Save as Image: Take a high-resolution screenshot (PNG or JPG) of the chart you want analyzed.
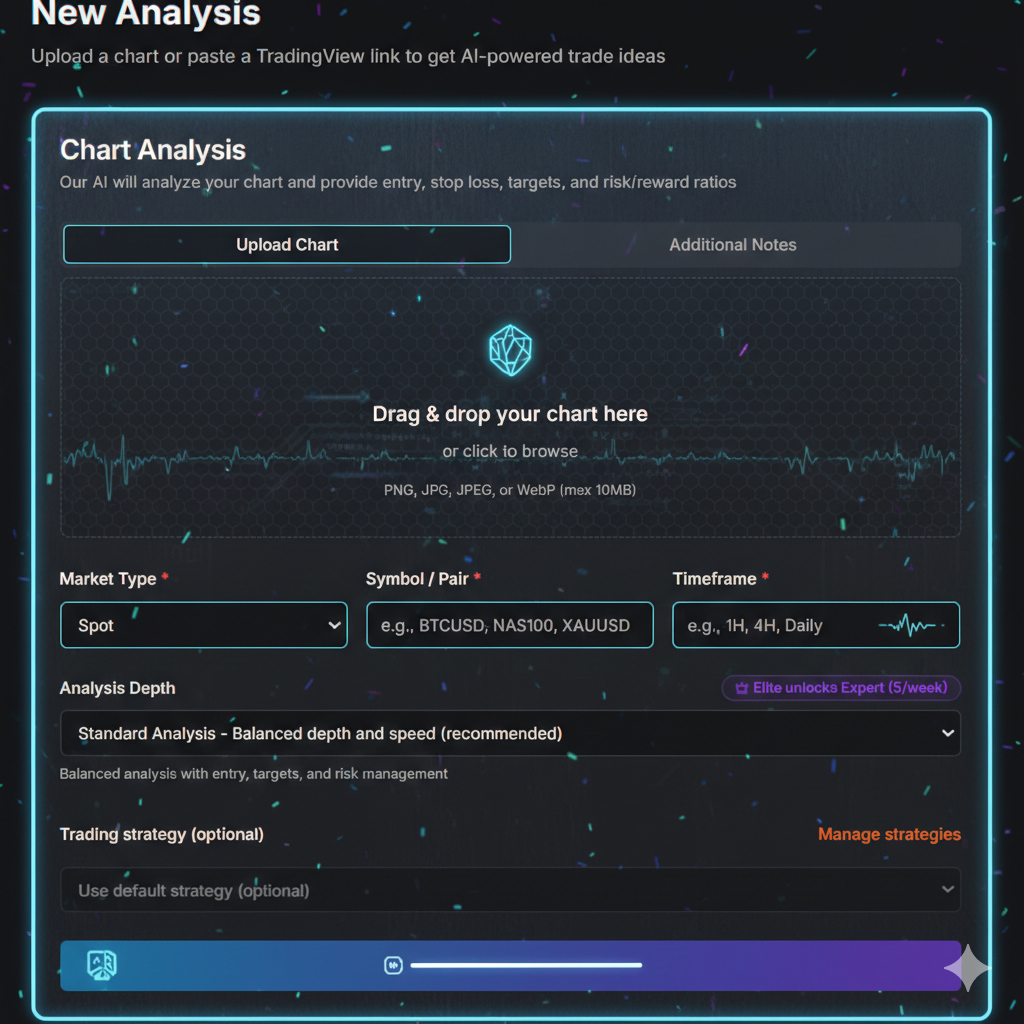
Step 2: Upload and Configure
Head over to the New Analysis section of our app. This is where the magic happens.
Drag & Drop: Simply drop your screenshot into the upload box.
Market Type: Select whether you are trading Spot, Futures, or Options.
Symbol / Pair: Type in the asset (e.g.,
BTCUSD,NAS100, orXAUUSD) so the AI has context on the asset's typical volatility.Timeframe: Specify if the chart is a 1H, 4H, or Daily view. This is crucial because a bullish 15-minute trend might actually be a bearish pullback on the Daily chart.
Step 3: Choose Your Strategy (Optional)
You can use our Default Strategy or select a custom one from your "Manage Strategies" list.
Want the AI to look specifically for Fibonacci pullbacks?
Or maybe you're an Auction-Market Theory expert? Selecting a strategy tells the AI what specific "lens" to look through when interpreting your data.
Step 4: Analyze and Execute
Hit the Analyze Chart button. In about 10–15 seconds, the AI scans thousands of data points. It doesn't just "guess"; it recognizes over 200 chart patterns and 150 candlestick formations instantly.
What you’ll receive:
Trend & Sentiment: A clear verdict on whether the market is Bullish, Bearish, or Neutral.
Key Levels: Precise identification of Support and Resistance zones.
Trade Parameters: A structured plan including Entry Price, Stop Loss, and multiple Take-Profit Targets.
Risk/Reward Ratio: An automated calculation to ensure the trade is worth the risk.
Final Thought: You are the Pilot
AI is your co-pilot—it doesn't fatigue, it doesn't trade on emotion, and it sees patterns your eyes might miss. However, final execution always remains in your hands. Use these AI-generated insights to validate your own bias and refine your entries.


