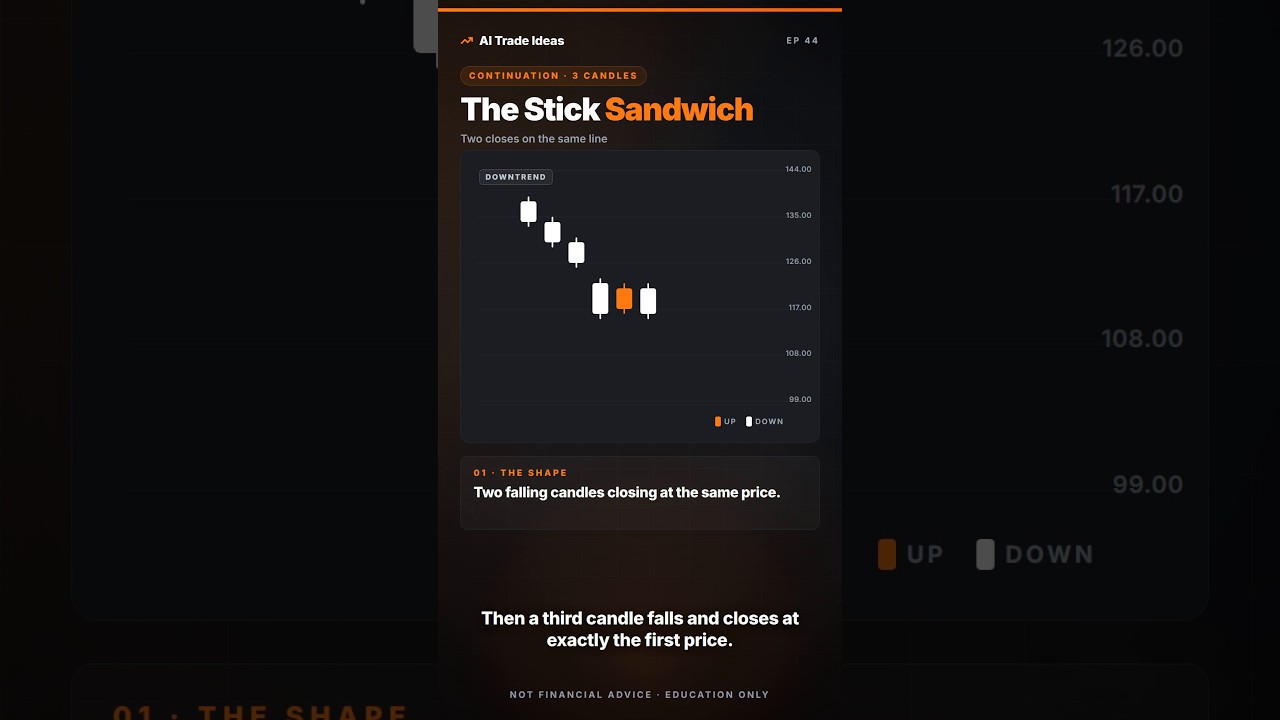
Rare Candlestick Patterns Nobody Explains Properly (Full Course)
A candlestick pattern is a short sequence of one or more candles whose shape and position relative to prior price action can mark a shift in control between buyers and sellers.
What the pattern is
Each of the fifteen patterns is a distinct arrangement of one to five candles. Some, like the long-wick candle or the dragonfly doji, are single-candle shapes; others, such as the rising three methods or the mat hold, require a series of candles that together tell a short story. All of them have been recorded in Japanese charting texts for centuries, yet they remain outside most introductory lessons.
What forms it
The pattern appears only when price has first traveled in a clear direction. A bullish kicker needs an established down-move before the gap-up open; a tweezer bottom needs a prior decline that brings price near a visible low. The three questions that decide every pattern—where the sequence occurs, what price did immediately before it, and whether the next candle confirms the implied shift—filter out identical shapes that form in unrelated places.
What confirms it
Confirmation is supplied by the candle that follows the pattern. If the pattern suggests buyers have taken control, the next candle must close higher than the pattern’s extreme; if sellers are said to have seized the advantage, the next close must be lower. Without that agreement the shape is disregarded, regardless of how textbook-perfect it looks on the chart.
How it fails
The pattern fails when any of the three questions receives a negative answer: it forms after the wrong kind of move, it appears in the middle of a range rather than at a swing point, or the following candle moves against the expected direction. In those cases the shape is treated as noise and price is allowed to continue without reference to the pattern.